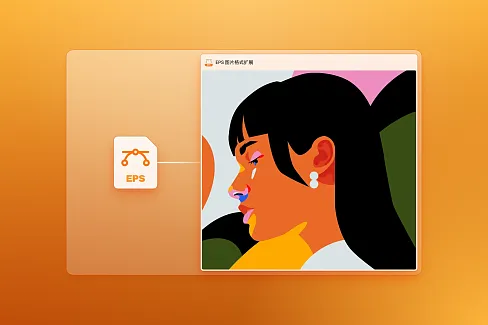
IES Format Extension
Master professional lighting design with interactive photometric visualization. Analyze light distribution and luminaire data directly in your Eagle library.
.ies files, visualizing photometric data and luminaire information, streamlining the workflow for designers, 3D artists, and lighting professionals.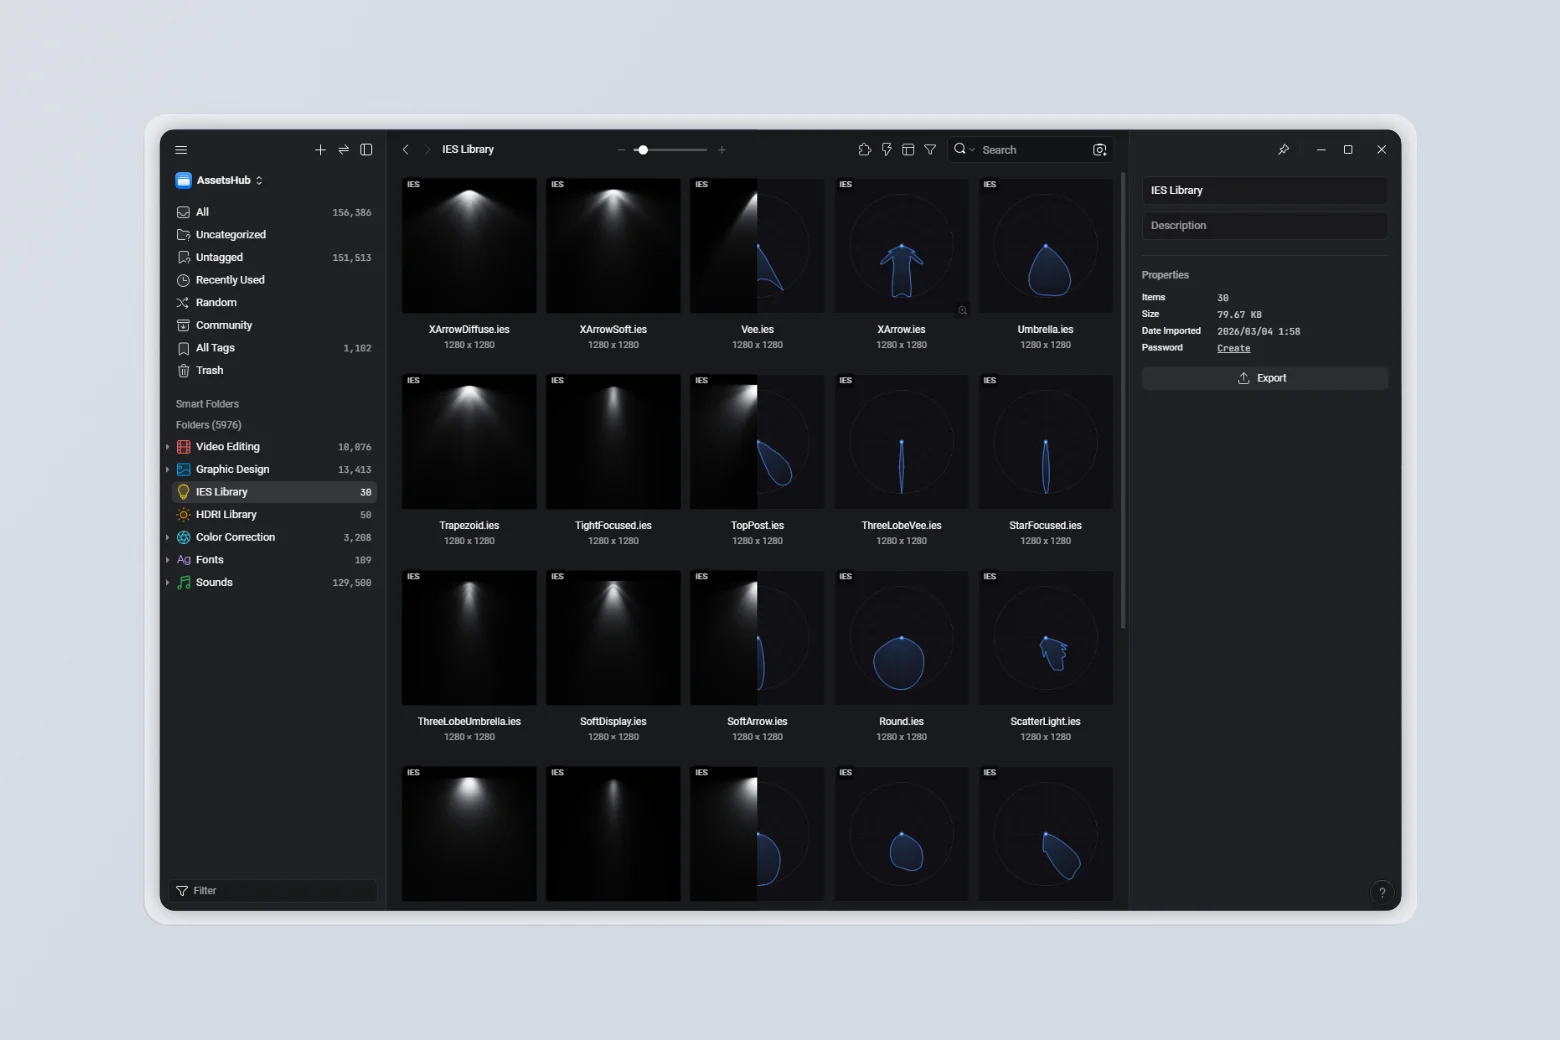
Key Features
-
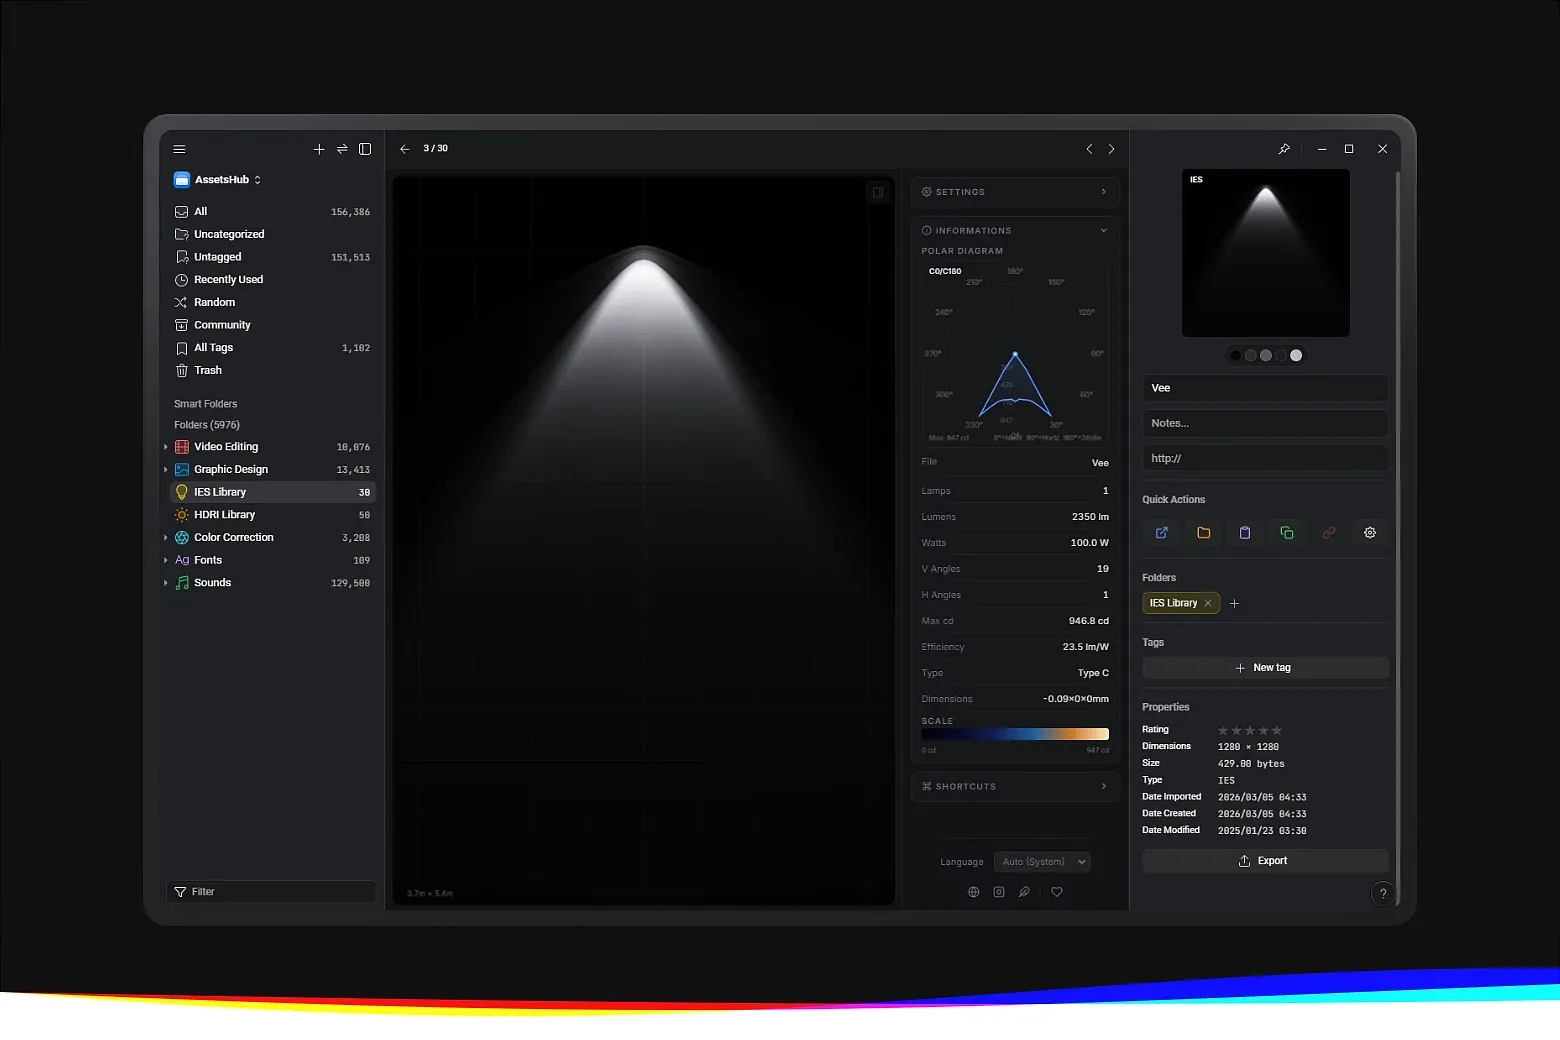
Photometric Data Visualization – Full IES light distribution diagrams, with options to adjust brightness, temperature, spread, quality, and isolines
-
Professional Lighting Support – Compatible with IES (Interstate Energy Standard) format files
-
Instant File Recognition – Automatically identifies and previews
.iesfiles in your library -
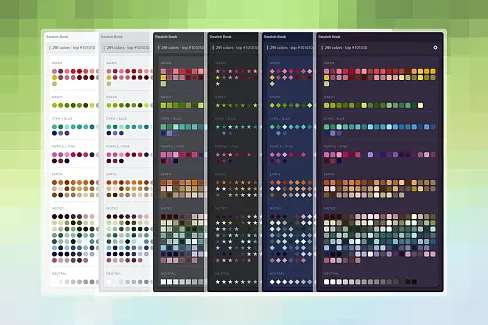
Interactive Polar Diagram – Visualize light intensity and distribution patterns, with customizable diagram and background colors
-
Realistic Thumbnail Generation – Create realistic thumbnails or polar diagrams directly in your library
-
Theme Matching Eagle – Adapts to Eagle’s selected theme for comfortable viewing
-
Quick Thumbnail Refresh – Configure your preferred view, right-click one or multiple items, go to More → Refresh Thumbnail, or use the standard shortcut
Ctrl + Alt + R -
Multi-language Support – Available in 13 languages
How It Works
-
Install the IES Format Extension in Eagle
-
Add your
.ieslighting files to your library -
Select any IES file to view its photometric data
-
Use the interactive polar diagram or generate realistic thumbnails, adjusting brightness, temperature, spread, quality, isolines, and diagram/background colors
-
To update thumbnails, configure your view, right-click one or more items, choose More → Refresh Thumbnail, or use
Ctrl + Alt + R
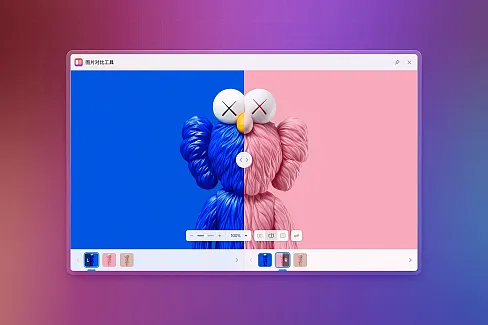
[Add] Thumbnail Split Mode - Added a new Split thumbnail type that combines the realistic light preview on the left side with the polar diagram on the right side in a single unified composition.
[Improvement] Isolines Rendering - Reworked isoline visualization to better follow the beam distribution with smoother contour transitions and a more faithful intensity response.
- Initial preview release